Mahalanobis distance among 5 points:
Mahalanobis distance among 5 points:
To create a plot with five points and visualize the Mahalanobis distances between them, lets modify the above code as given in example below:
import numpy as np
import matplotlib.pyplot as plt
from scipy.spatial import distance
# Define the five points as arrays
points = np.array([[1, 2],
[4, 5],
[2, 9],
[7, 3],
[5, 7]])
# Define the covariance matrix
covariance = np.array([[2, 0],
                       [0, 3]])
# Compute the pairwise Mahalanobis distances
mahalanobis_distances = distance.cdist(points, points, 'mahalanobis', VI=np.linalg.inv(covariance))
# Create a scatter plot of the points
plt.scatter(points[:, 0], points[:, 1], color='blue', label='Points')
# Plot the Mahalanobis distances as lines
for i in range(len(points)):
    for j in range(i + 1, len(points)):
        plt.plot([points[i, 0], points[j, 0]], [points[i, 1], points[j, 1]], color='red', alpha=0.4)
# Set plot title and labels
plt.title('Mahalanobis Distances')
plt.xlabel('X')
plt.ylabel('Y')
# Add a legend
plt.legend()
# Set axis limits
plt.xlim(0, 8)
plt.ylim(0, 10)
# Show the plot
plt.show()
# Print the Mahalanobis distances
print("Mahalanobis distances:")
for i in range(len(points)):
    for j in range(i + 1, len(points)):
        print(f"Distance between Point {i+1} and Point {j+1}: {mahalanobis_distances[i, j]}")
In this code, we have an array points with five points, represented as (X, Y) coordinates. The covariance matrix covariance is defined to compute the Mahalanobis distances.
We use nested loops to compute pairwise Mahalanobis distances between each point and plot them as lines connecting the points.
Output:
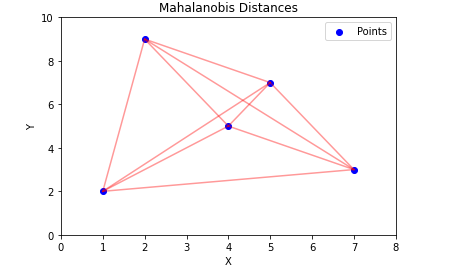
The scatter plot displays the points as blue dots, and the Mahalanobis distances are shown in red lines.The plot has labeled axes, a legend, and axis limits set to accommodate the point positions.
Output:
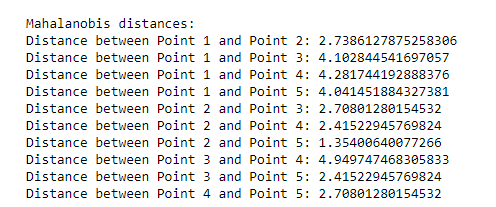
Finally, the Mahalanobis distances are also printed for each pair of points.
Hey!! If you like my content, click here to support my writing.


Comments
Post a Comment